...
Often, it is useful to create a heat-map from a data image to visualise its content. This function offers a few controls to generate heat maps from single-channel images or the luminance of a color image. You can select more than one image to process at once.
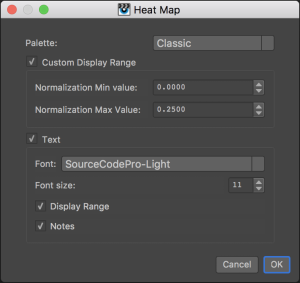
Palette
There are 3 different palettes you can choose from: Classic, Fire and Hue
Custom Display Range
When this is un-checked, the heat map is displayed using the pixels' min-max values, otherwise it uses fixed values of your choice. It is useful to use a fixed range when comparing different images, like the sampleCount AOV for different renders.
- Normalization Min Value: the lowest value visualised.
- Normalization Max Value: the highest value visualised.
Text
You can add some text at the bottom of the image with the minimum, maximum and average values, plus a couple of optional fields:
- Font: choose a font you like
- Font size: adjust the font size, bearing in mind that everything must fit on a single line.
- Display Range: display the custom display range values.
- Notes: display any notes the source image might hold.
Isolate Values
Dump Metadata to message log
...