Contents
Katana uses Ops to build and modify the attribute state of your scene. Some ops have a visible effect within the interactive Katana session, but some run behind the scenes. If you write your own terminal ops or are trying to debug why an attribute isn't making it to the render, it can be extremely useful to inspect the attribute state at the point your op runs. The PrmanOpDebug node lets you inspect the full suite of ops - Interactive Render Filters (IRFs), Implicit Resolvers, and Terminal Ops.
How to use the node
- Insert the node at the end of your Node Graph - right before the Render node if there is one
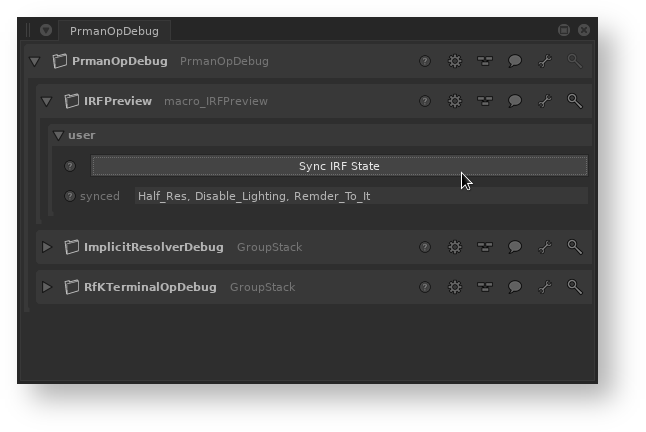
- The node will automatically populate with the current IRF, Implicit Resolver, and Terminal Op state.
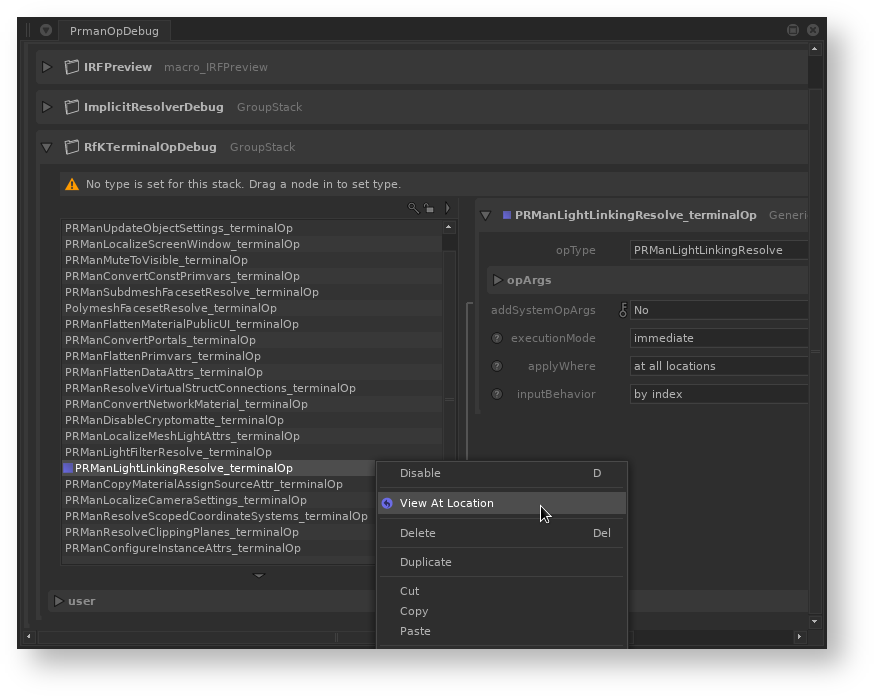
- You can view the full list of ops by expanding each group in the Parameters Tab
- To view the affect of a certain Op, you can right click on the op name and select "View at Location"
- You can view the attribute state in Katana's Attributes Tab.
- Note that this node doesn't pick up any changes to your scene's Op and IRF state after it is created. There is a button to refresh each op type under their respective user groups.