The traditional RenderMan stats gathering and reporting continue to be available. The options remain the same, as does the Javascript-based XML output which can be read by dragging and dropping the file into an empty browser window. Customized queries and reports can be implemented with modest effort using a variety of off-the-shelf XML technologies.
Overall statistics output is controlled by the following options:
Option "statistics" "level" [ N ]
Option "statistics" "filename" [ "filename.txt" ]
Option "statistics" "xmlfilename" [ "filename.xml" ]
where N is either 0 or 1. A brief plain-text summary of the statistics is written to one file (according to the "filename" option), while the full XML report is written to another file (the "xmlfilename" option). Statistics are not accumulated in the output file from one render to the next.
Either filename may be the empty string, which disables that kind of output, or "stdout", in which case the output is displayed on the console. (Note that XML written to stdout might not be well formed if procedural or shader plugins also write to stdout.) The default value of "filename" is "stdout", and the default value of "xmlfilename" is the empty string. These defaults can be changed by editing the RenderMan configuration file (etc/rendermn.ini).
The "xmlfilename" can be set to a special value, "usefilename", which indicates that XML statistics should be written to the filename that would normally receive the plain-text statistics. Doing so can facilitate incorporating XML statistics into pipelines without requiring changes to RIB generators.
See Renderer Options for the statistic options reference.
A render must complete in order to get the completed xml file. |
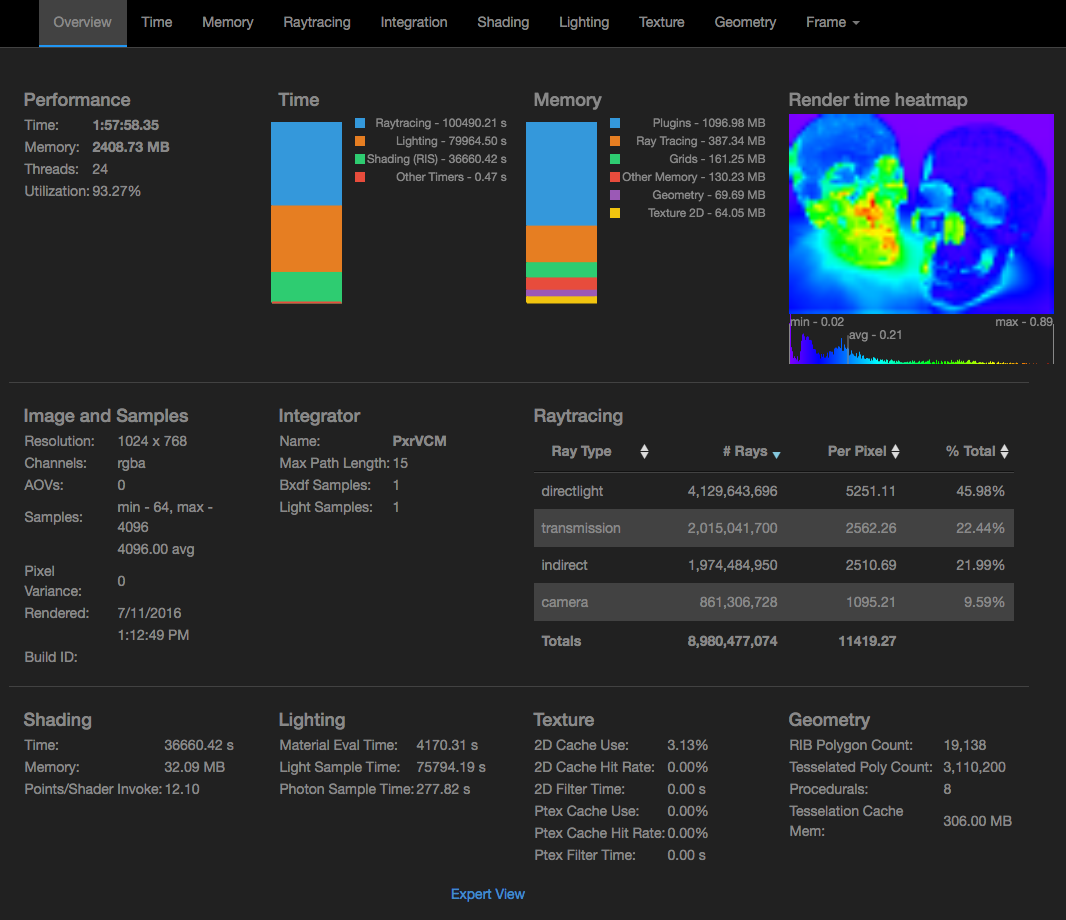
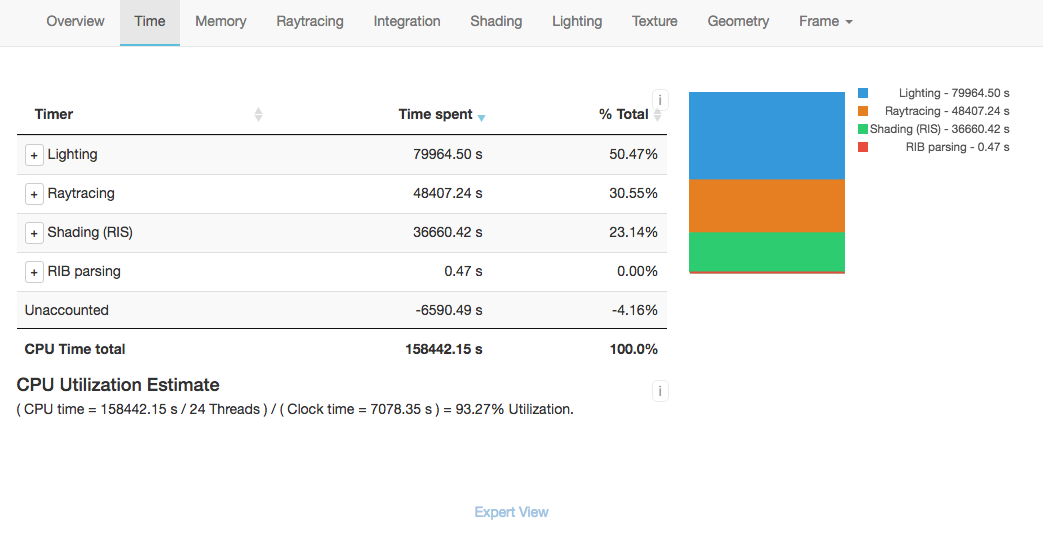
Below is an example of the main Overview of the legacy XML render stats:

XML Stats Overview Page
This system for viewing stats files decouples the viewing of statistics files from XML data and allows users to easily customize the way they view the data.

Ray Tracing Statistics
The plain-text output of Option "statistics" "filename" summarizes renderer version information, image format information, and overall resource usage (time and memory).
Pixar PhotoRealistic RenderMan 24.0b1
copyright (c) 1988-2021 Pixar.
linked Thu Jan 14 10:13:53 2021 PST ###########
build linuxRHEL7_x86-64_gcc63icc190_external_debug

Rendered on Fri Jan 15 10:09:23 PST 2021
Rendering at 640x480 pixels, 2048 maxsamples
	"__NULL__Ci" (mode = Ci_variance_auto, type = null)
	"__NULL__a" (mode = a_variance_auto, type = null)
	"/tmp/min_ris.exr" (mode = Ci,a, type = openexr)

         Total heap mem: 9512.33 MB
       Max resident mem: 833.42 MB
            Page faults: 158
       Real time:     00:14
       User time:     12:08
       Sys time:      00:07
Max resident mem - The maximum resident set size used by the renderer, measured in megabytes. Basically, this is the maximum amount of physical memory which the operating system sets aside for the renderer.
Page faults - The number of "hard" page faults - the number of times that a page of virtual memory in use by the renderer had to be swapped out to disk.
Page reclaims (platform dependent) - The number of page faults serviced without any I/O activity (i.e. having to swap to disk); here I/O activity is avoided by "reclaiming" a page frame from the list of pages awaiting reallocation.
Real time - The amount of "wall clock" time elapsed since the beginning of the frame render.
User time - The amount of time spent executing user instructions on behalf of the renderer. Note that in multithreaded renders, the amount of user time is summed over all CPUs, so this number may be more than the real time.
Sys time - The total amount of time spent in the operating system kernel executing instructions on behalf of the renderer. The sum of this time and the user time is a good indication of the total CPU time (summed over all CPUs).
This resource usage summary is useful for timing renders as well as monitoring memory usage. For example, when the system memory is low the operating system may undergo excessive virtual memory paging ("thrashing"). This is something that should generally be avoided, as shown by the wall clock time in the summary below generated for the same scene above, rendered in a low memory situation. Note the number of page faults, and compare the maximum resident memory with the memory allocated by the renderer.
Note: The above example is from a Linux render. Other platforms may have slightly different output but will convey the equivalent information. |
RenderMan supports basic time/memory logging during a render. If the logging level is set to "INFO" (e.g. prman -loglevel 4) then a final summary report will be written to either the log file or to stdout:
00:00:00.00 8.76GB Info   | memory
00:00:00.00 8.75GB Info   |   heap                 8968 MB
00:00:00.00 8.74GB Info   |   peak resident        729 MB
00:00:00.00 8.74GB Info   |   page faults          0
00:00:00.00 8.74GB Info   | ray types              count       /camera    /pixel
00:00:00.00 8.73GB Info   |   camera               1739312        1.00      4.69
00:00:00.00 8.72GB Info   |   transmission         359510         0.21      0.97
00:00:00.00 8.71GB Info   |   directlight          282515         0.16      0.76
00:00:00.00 8.71GB Info   |   indirect             248135         0.14      0.67
00:00:00.00 8.70GB Info   |   total                2629472        1.51      7.08
00:00:00.00 8.69GB Info   | total time
00:00:00.00 8.68GB Info   |   clock                00:00:00.86
00:00:00.00 8.68GB Info   |   user                 00:00:10.20
00:00:00.00 8.67GB Info   |   system               00:00:03.08
If the "progress" option is also given then the current render time and memory will be printed as the render progresses:
00:00:00.20 7.68GB Info   | R90000    0%
00:00:00.55 9.06GB Info   | R90000    1%
00:00:00.59 9.06GB Info   | R90000    2%
...