Overview
RenderMan diagnostics have a built-in configuration for live data that is always presented in the it tool, toggled on with the "V" (capital "vee") shortcut. For DCC plugins the live stats are also built-in but are not enabled by default. This is a prototype feature that may require manual configuration as explained in Live Statistics Configuration.
Advanced users may also configure other presentation Listeners through Configuration of RenderMan diagnostics primarily affects the presentation and reporting of data. There is no need to configure the gathering of stats; it is built into the renderer and cannot be disabled. The presentation of stats, however, is configurable through the use of an INI-style configuration file.
Live
...
Each DCC has a window dedicated to Live Statistics presentation and configuration. Below is a snapshot of the configuration options as seen in RenderMan for Maya:
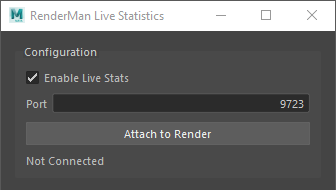
Enable Live Stats
Toggle this on to enable the built-in WebSocket server and connect the DCC's client window to the live data stream. This works best if only one render is connected at a time, on the default port.
WebSocket Port
In the event multiple renders are attempting to run live stats, each render will need a unique WebSocket port configured manually. The default port is 9723.
Connect/Disconnect
When Enable List Stats is active, the Attach to Render button becomes available for manually connecting and disconnecting from a running render.
Status
The bottom line of the configuration portion of the Live Statistics window is the current state of the connection if the Live Stats Server is enabled.
| Warning |
|---|
Occasionally the system fails to initialize the live stats with one or both of the following messages:
This can sometimes happen if the port is used in multiple places, or hasn't finished shutting down from a previous run. Changing the port in the configuration UI will usually resolve the issue. |
| Note |
|---|
Configuration options for live stats are limited as this is a prototype feature. As the system evolves so will the ability to create custom configurations of live stats. |
...
Stats
Live stats are enabled by default, which means that the system will automatically set up an internal server (the Live Stats Server) for reporting live stats for any running render. The it tool displays the tracked metrics as part of its HUD, and each DCC plugin also has a built-in "Live Stats" presentation panel. The Live Stats Server can be toggled on/off through prefs or the configuration file but the set of metrics collected by the system is currently not configurable.
| Note |
|---|
Stats presentation for live interaction is enabled in RenderMan by default. The ability to attach to a render running on a farm is a feature planned for the future but not currently supported. The live stats system will spawn a background process |
| Anchor | ||||
|---|---|---|---|---|
|
Configuration File
Default Configuration
...
The stats configuration file (default name: "stats.ini") holds holds the basic default settings for the a stats session. It can also be utilized for advanced configuration to build a list of listeners to attach, and per-listener rules for metric data to be observed by each listener.Below is an example of a simple configuration file that enables an end-of-render JSON report, including checkpoints: Below is the default configuration for the stats system, equivalent to the default behavior of the system if there were no configuration file specified:
| Code Block | ||||||||
|---|---|---|---|---|---|---|---|---|
| ||||||||
# checkpoint_stats.ini # Roz Stats default configuration file # # Copy this file to: /a/path/of/your/choosing/stats.ini # then run: # prman -statsconfigset RMAN_STATS_CONFIG_PATH = /a/path/of/your/choosing/checkpoint_stats.ini version 0.1 # Set this to 1 for extra information when parsing this file verbose 10 # Stats processing log level. # Range is 0 (none) to 5 (debug output). Default is 3 (warnings) logLevel 53 # Session configuration [Session] name "Checkpoint Session" # ListDistinguishing ofname listenersfor which thethis session should create and manage. [ManagedListeners] configuration name "RMANTREE Session" # JSONEnable outputthe report listener [Listener] type "jsonreport" name "jsonListener" outputFilename "checkpoint_stats.json" keepAllCheckpoints 1 [MetricRules] # Save all metrics to the JSON file, sampled once per second [Rule] regexp ".*" samplingInterval 1000 |
| Note |
|---|
This example configuration file has both the |
The stats configuration file is provided to the prman command via the "-statsconfig" option:
| Code Block |
|---|
prman -statsconfig /path/to/checkpoint_stats.ini /path/to/rib/scene.rib |
See JSON Report Listener reference page for JSON output configuration options.
Config File Search Order
If command-line prman is not provided a config file via the -statsconfig option then the default configuration filename "stats.ini" will be used.
internal live stats server
liveStatsEnabled 1

# List of listeners which the session should create and manage.
#[ManagedListeners] |
This file can be found in the RenderMan distribution at $RMANTREE/etc/stats.ini
Config File Search Order
Command-line prman will search for the stats The stats system will search for the configuration file in the following order:
| Order | Location | Default |
|---|---|---|
| 1 | /stats/configpath setting in rendermn.ini | .:${RMANTREE}/etc |
| 2 |
| none |
| 3 | prman -statsconfig </path/to/filename.ini> | stats.ini |
If you specify an absolute path on the command line it will override any requested search paths. This is a convenient way to do quick testing without having to modify an existing config file. Maybe For example, suppose you normally run with a certain configuration of listeners, but then want to do a render with details printed to the console about a specific metric or group of metrics. You could do a debugging run that temporarily overrides the default configuration in one of two ways . By - either by setting/pre-pending the environment variable override:
| Code Block |
|---|
setenv RMAN_STATS_CONFIG_PATH /my/test/directory prman -statsconfig debug_stats.ini complicatedScene.rib |
Or by providing a full-path, absolute file name:
| Code Block |
|---|
prman -statsconfig /my/test/directory/debug_stats.ini complicatedScene.rib |
Both of these methods will load the stats configuration from "/my/test/directory/debug_stats.ini"
| Note |
|---|
If a configuration file name is not specified via the |
| Notewarning |
|---|
Currently, configuration files are not merged if more than one is found. The last one found wins. Future releases will include advanced configuration mechanisms, including the merging of configuration files. |
| Note |
|---|
Listener control and configuration are not yet dynamic. In most cases, a render must be restarted in order to see the configuration change. In the case of RfM and RfB, the application will need to be restarted. |
| Anchor | ||||
|---|---|---|---|---|
|
Disabling Live Stats for Farm Renders
The ability to attach to a render running on a farm is a feature planned for the future but not currently supported. The live stats system will spawn a background process sbrokerd which can interfere with process lifetime and cgroup management of farm processes therefore it is recommended that live stats be explicitly disabled for farm renders using a bespoke pipeline configuration file.
In a nutshell, an explicit configuration file is needed that sets the config option liveStatsEnabled to 0.
The following example is the minimum configuration file needed to turn live stats off. Place the config file in a known location and either add the prman -statsconfig command-line option or set the RMAN_STATS_CONFIG_PATH accordingly.
| Code Block | ||||||||
|---|---|---|---|---|---|---|---|---|
| ||||||||
# stats.ini
# Roz Stats farm configuration file
[Session]
name "Farm Stats Session"

# Disable the internal live stats server
liveStatsEnabled 0 |
| Warning |
|---|
It is not recommended to disable this option in the default $RMANTREE/etc/stats.ini file as that will disable live stats for all renders, including DCC interactive renders. Please pass RenderMan the new |
...
| Anchor | ||||
|---|---|---|---|---|
|
DCC Configuration
A live stats configuration UI pane is available in all RenderMan bridge products, with the exception of Solaris which does not yet have support for the new stats system. In addition, advanced configuration with an INI file is also available through the use of the config environment variable. See below for DCC-specific details.
...
prmanGlobalStatements.stats.configPath (default: ".:${RMANTREE}/etc")
prmanGlobalStatements.stats.configFile (default: "stats.ini")
...
If no file is found, or if that environment variable is not set then the default configuration will be used.
Solaris
...
If the RMAN_STATS_CONFIG_PATH environment variable is set RfH will use that search path to look for a file named stats.ini.
If no file is found, or if that environment variable is not set then the default configuration will be used.
| Warning |
|---|
Houdini/Solaris Known Issue: Live stats will only work properly with either Solaris or Classic Houdini. If a scene is being rendered in one and then switched to the other the live stats will no longer work reliably. If this happens the scene must be closed and reopened, or the application must be restarted. |
...
Diagnostic Reports
Advanced users may also use the configuration file to build and configure a list of presentation Listeners, each with a set of rules for metric data to be observed by that listener.
Checkpoint Render Report
For example, below is an example of a configuration file that enables an end-of-render JSON report, including checkpoints:
| Code Block | ||||||||
|---|---|---|---|---|---|---|---|---|
| ||||||||
# checkpoint_stats.ini
# Stats default configuration file
#
# Copy this file to: /a/path/of/your/choosing
# then run:
# prman -statsconfig /a/path/of/your/choosing/checkpoint_stats.ini

version 0.1

# Set this to 1 for extra information when parsing this file
verbose 1

# Stats processing log level.
# Range is 0 (none) to 5 (debug output). Default is 3 (warnings)
logLevel 5

# Session configuration
[Session]
name "Checkpoint Session"

# List of listeners which the session should create and manage.
[ManagedListeners]

# JSON output report listener
[Listener]
    type "jsonreport"
    name "jsonListener"
    outputFilename "checkpoint_stats.json"
	keepAllCheckpoints 1

[MetricRules]
    # Save all metrics to the JSON file, sampled once per second
    [Rule]
    regexp ".*"
samplingInterval 1000 |
See JSON Report Listener reference page for JSON output configuration options.
| Comment |
|---|
OLD CONFIGURATION, TO BE PORTED TO NEW CONFIG UILive Statistics ConfigurationEach DCC has a window dedicated to Live Statistics presentation. When available (RfM, RfH) the window also includes basic configuration options. Below is a snapshot of the configuration options as seen in RenderMan for Maya: Enable Live StatsToggle this on to enable the built-in WebSocket server and connect the DCC's client window to the live data stream. This works best if only one render is connected at a time, on the default port. PortIn the event multiple renders are attempting to run live stats, each render will need a unique port, configured manually. The default port is Connect/DisconnectWhen Enable Live Stats is active, the Attach to Render button becomes available for manually connecting and disconnecting from a running render. StatusThe bottom line of the configuration portion of the Live Statistics window is the current state of the connection if the Live Stats Server is enabled. |